Archives de l’auteur : yoannbazin

Problematizing revolving doors: conflicts of interests, regulatory capture and habitus convergence

Problematizing revolving doors:

conflicts of interests, regulatory capture and habitus convergence

Y. Bazin – y.bazin@istec.fr  – ISTEC

Abstract:

Focusing on investment banks in the financial sector, this paper aims at understanding the underlying dynamics of convergence amongst interests and worldviews between regulatory institutions and regulated organizations. The concept of revolving doors between public and private sectors will appear as problematically central, especially considering that their intensification in the last 30 years. Using Bourdieu’s framework, we will consider these continuous revolving doors as strong participants to the convergence of actors’ habitus between financial corporations and their regulatory institutions.
Texte : Problematizing revolving doors

Lire la suite

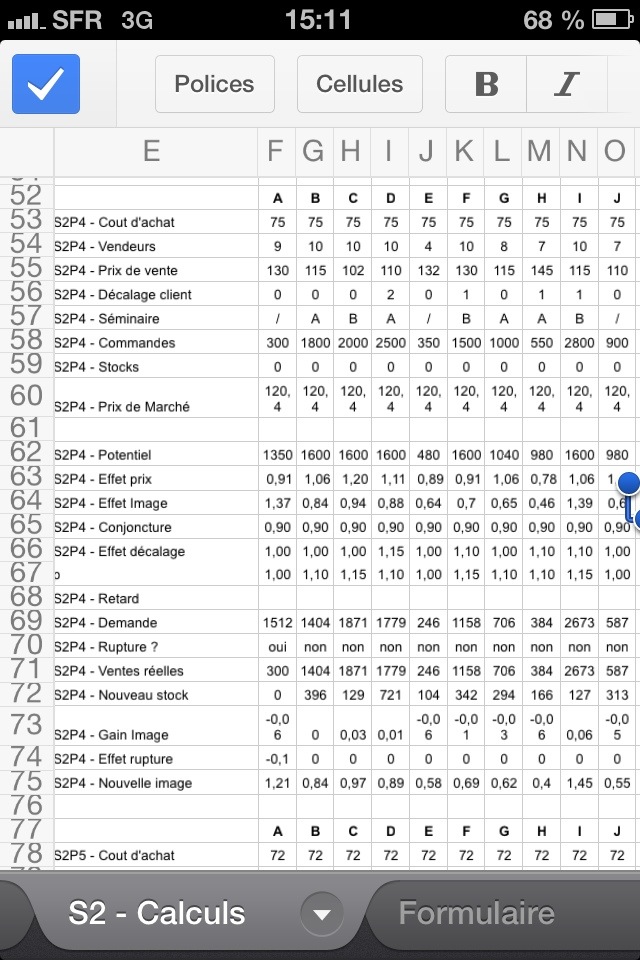
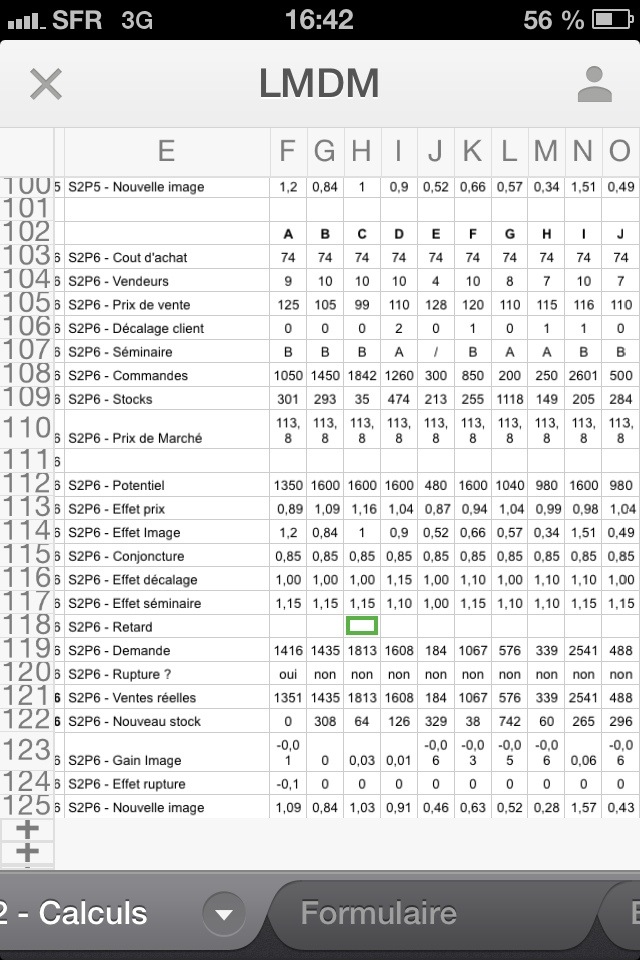
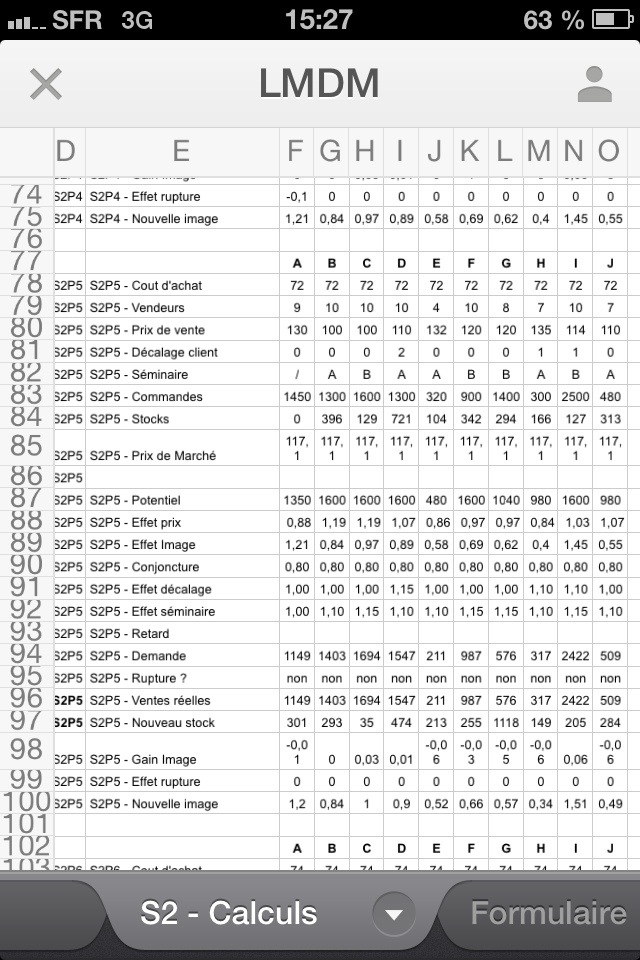
Résultats S2P3

S P A B C D E F G H I J
2 3 S2P3 S2P3 – Cout d’achat 78 78 78 78 78 78 78 78 78 78
2 3 S2P3 S2P3 – Vendeurs 10 10 10 10 4 10 8 7 10 7
2 3 S2P3 S2P3 – Prix de vente 130 115 100 110 120 132 130 140 118 105
2 3 S2P3 S2P3 – Décalage client 0 0 0 2 1 0 0 1 0 0
2 3 S2P3 S2P3 – Prix de Marché 120 120 120 120 120 120 120 120 120 120
2 3 S2P3
2 3 S2P3 S2P3 – Potentiel 1600 1600 1600 1600 480 1600 1040 980 1600 980
2 3 S2P3 S2P3 – Effet prix 0,90 1,05 1,22 1,11 1,00 0,89 0,90 0,82 1,02 1,16
2 3 S2P3 S2P3 – Effet Image 1,34 0,85 0,93 0,88 0,7 0,73 0,71 0,52 1,33 0,65
2 3 S2P3 S2P3 – Conjoncture 1,05 1,05 1,05 1,05 1,05 1,05 1,05 1,05 1,05 1,05
2 3 S2P3 S2P3 – Effet décalage 1,00 1,00 1,00 1,15 1,10 1,00 1,00 1,10 1,00 1,00
2 3 S2P3 S2P3 – Retard
2 3 S2P3 S2P3 – Ventes réelles 2037 1501 1908 1879 388 1088 702 482 2280 777
2 3 S2P3 S2P3 – Gain Image 0,03 -0,01 0,01 0 -0,06 -0,03 -0,06 -0,06 0,06 -0,05
2 3 S2P3 S2P3 – Nouvelle image 1,37 0,84 0,94 0,88 0,64 0,7 0,65 0,46 1,39 0,6

Résultats S2P2

S P A B C D E F G H I J
2 2 S2P2 S2P2 – Cout d’achat 75 75 75 75 75 75 75 75 75 75
2 2 S2P2 S2P2 – Vendeurs 10 8 10 8 4 10 5 7 10 6
2 2 S2P2 S2P2 – Prix de vente 125 125 100 110 135 135 125 130 114 105
2 2 S2P2 S2P2 – Décalage client 0 1 0 1 1 0 0 0 0 2
2 2 S2P2 S2P2 – Prix de Marché 120,4 120,4 120,4 120,4 120,4 120,4 120,4 120,4 120,4 120,4
2 2 S2P2
2 2 S2P2 S2P2 – Potentiel 1600 1040 1600 1040 480 1600 700 980 1600 900
2 2 S2P2 S2P2 – Effet prix 0,96 0,96 1,23 1,11 0,86 0,86 0,96 0,91 1,07 1,17
2 2 S2P2 S2P2 – Effet Image 1,31 0,88 0,92 0,88 0,76 0,74 0,77 0,58 1,27 0,7
2 2 S2P2 S2P2 – Conjoncture 1,00 1,00 1,00 1,00 1,00 1,00 1,00 1,00 1,00 1,00
2 2 S2P2 S2P2 – Effet décalage 1,00 1,10 1,00 1,10 1,10 1,00 1,00 1,00 1,00 1,15
2 2 S2P2 S2P2 – Retard
2 2 S2P2 S2P2 – Ventes réelles 2002 961 1805 1117 347 1023 515 516 2166 845
2 2 S2P2 S2P2 – Gain Image 0,03 -0,03 0,01 0 -0,06 -0,01 -0,06 -0,06 0,06 -0,05
2 2 S2P2 S2P2 – Nouvelle image 1,34 0,85 0,93 0,88 0,7 0,73 0,71 0,52 1,33 0,65

Résultats S2P1

S P A B C D E F G H I J
2 1 S2P1 S2P1 – Cout d’achat 80 80 80 80 80 80 80 80 80 80
2 1 S2P1 S2P1 – Vendeurs 8 6 10 8 4 10 5 6 7 6
2 1 S2P1 S2P1 – Prix de vente 125 105 102 130 140 135 118 135 117 110
2 1 S2P1 S2P1 – Décalage client 0 0 0 0 0 1 1 1 1 1
2 1 S2P1 S2P1 – Prix de Marché 121,7 121,7 121,7 121,7 121,7 121,7 121,7 121,7 121,7 121,7
2 1 S2P1
2 1 S2P1 S2P1 – Potentiel 1040 900 1600 1040 480 1600 700 900 980 900
2 1 S2P1 S2P1 – Effet prix 0,97 1,18 1,22 0,92 0,83 0,88 1,04 0,88 1,05 1,12
2 1 S2P1 S2P1 – Effet Image 1,3 0,89 0,86 0,91 0,82 0,74 0,83 0,64 1,24 0,75
2 1 S2P1 S2P1 – Conjoncture 1,10 1,10 1,10 1,10 1,10 1,10 1,10 1,10 1,10 1,10
2 1 S2P1 S2P1 – Effet décalage 1,00 1,00 1,00 1,00 1,00 1,10 1,10 1,10 1,10 1,10
2 1 S2P1 S2P1 – Retard 2
2 1 S2P1 S2P1 – Ventes réelles 1439 1041 1843 958 361 1254 730 549 1541 918
2 1 S2P1 S2P1 – Gain Image 0,01 -0,01 0,06 -0,03 -0,06 0 -0,06 -0,06 0,03 -0,05
2 1 S2P1 S2P1 – Nouvelle image 1,31 0,88 0,92 0,88 0,76 0,74 0,77 0,58 1,27 0,7